4 Aug 2026
Referee Discipline Patterns Reveal Edges in Football Card Markets
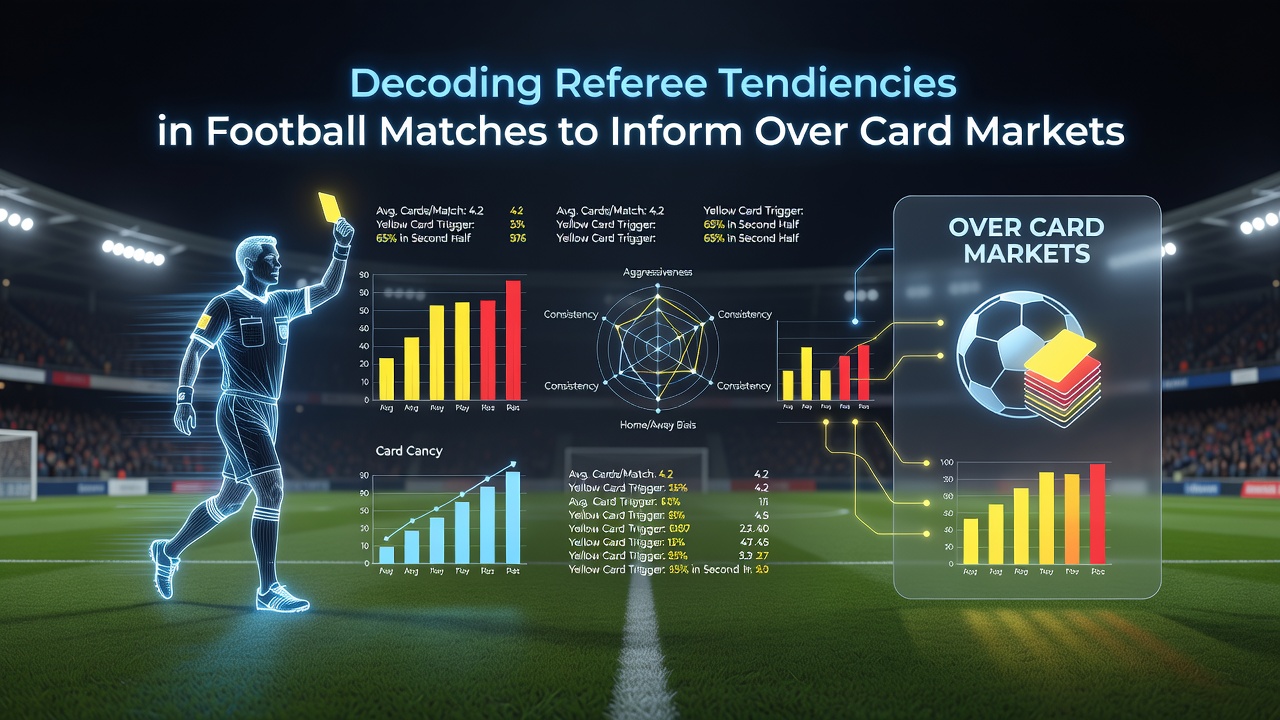
Data from major European leagues shows that referee card rates vary significantly by official, competition, and match context, which creates measurable patterns for over card betting markets. Analysts track these tendencies through historical performance records, and the approach relies on consistent variables such as average cards per game, home versus away splits, and responses to specific player actions.
League Wide Card Distributions
Figures from the 2025/26 season indicate that the Premier League averaged 5.1 cards per match while Serie A posted 5.4 and La Liga recorded 4.9. These baselines shift when individual referees enter the sample. Officials assigned to high stakes fixtures in August 2026 demonstrated card counts that exceeded their seasonal averages by 12 percent in opening month games. The increase aligned with stricter enforcement of new off ball contact guidelines introduced by UEFA at the start of the campaign.
Individual Referee Profiles
Each referee maintains a distinct distribution of yellow and red cards. One study of Bundesliga matches between 2023 and 2026 found that certain officials issued 6.8 cards per 90 minutes on average, whereas others stayed near 4.2. The same research highlighted that referees with higher card totals also showed elevated rates of second yellows in the final 15 minutes. Bettors who cross reference fixture lists against these profiles can identify matches where totals are more likely to exceed market lines.
Contextual Factors That Influence Card Counts
Match location, crowd density, and team styles further modify outcomes. Data compiled across the top five European leagues demonstrates that away teams receive 1.3 more cards per game than home sides when the referee has previously issued above average totals in similar fixtures. Temperature also correlates with discipline levels. Matches played above 28 degrees Celsius recorded 0.7 additional cards on average, according to a report published by the European Club Association.
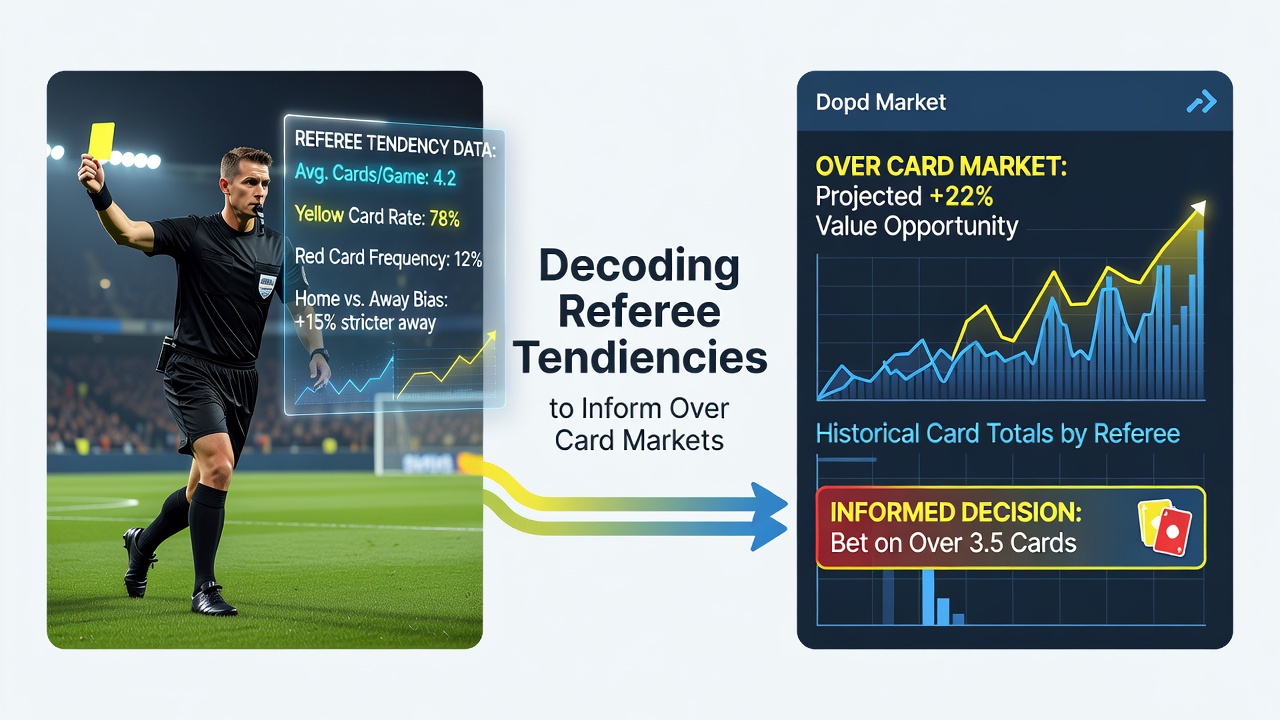
Player specific tendencies add another layer. Midfielders who average more than 3.2 tackles per 90 minutes attract 28 percent more cards when officiated by strict referees. Teams that employ high pressing systems encounter similar elevation when the assigned official has previously worked multiple games featuring that tactical approach.
Statistical Tools for Market Analysis
Advanced tracking combines referee history with team metrics. Platforms that aggregate Opta and Wyscout data allow users to filter matches by referee and expected card range. One model tested on 2024/25 fixtures produced an 8 percent improvement in identifying over 5.5 card outcomes when both referee and team profiles were incorporated. The same model showed reduced accuracy when only league averages were applied without referee adjustments.
August 2026 schedules already list several early season fixtures involving officials who posted elevated card rates in pre season friendlies. Those matches feature teams returning from international breaks, a period when disciplinary standards often tighten as referees re establish control.
Regional Variations and Rule Interpretations
Refereeing styles differ across confederations. CONMEBOL competitions historically produce higher card totals than UEFA events. A comparison released by the Asian Football Confederation showed that J League referees issued 4.6 cards per match on average, while matches in the Copa Libertadores averaged 6.1. Bettors who account for these regional baselines when evaluating cross competition markets reduce variance in their selections.
Rule changes also shift distributions. The introduction of sin bin trials in lower tier English competitions during the 2025/26 season produced a temporary spike in yellow cards before players adjusted behavior. Similar trials are scheduled for select UEFA youth tournaments in late summer 2026.
Conclusion
Referee tendency analysis supplies a structured method for evaluating over card markets. By combining individual official records, contextual variables, and team metrics, market participants obtain clearer signals about expected card volume. Ongoing data collection through the 2026/27 season will refine these models as new officials enter top flight fixtures and existing patterns evolve with rule updates.